
With Looker Studio - Newsletter #2


Hello,
I'm happy to send you this 2nd issue of "With Looker Studio" newsletter.
I had not suspected the success of the first issue. Thank you for your precious feedback, and to all the community spreading the word.
Today, "au menu":
Release note of April 17
My latest blog post about adaptative time granularity for scorecard sparkline
Just-for-fun shared report: Moving bikes from Tron movie
Mehdi
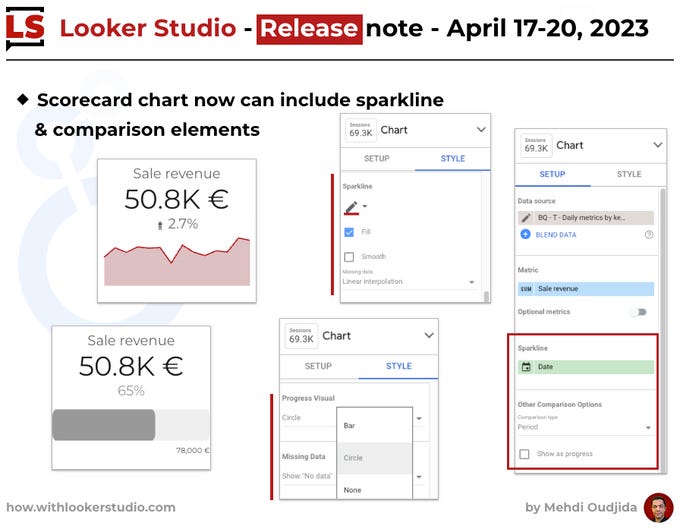
Looker Studio release - April 17-20, 2023
Scorecard charts can now include:
Sparklines
Progress bar or circle towards a target
Metric comparison to a time period, target value, or metric
Blog post
So, let's take advantage of the new sparkline feature for scorecards with this custom recipe. A way to improve trends consistency and visualization.

May 5, 2023 - How to build a scorecard sparkline with adaptative time granularity - Read the article
Just for fun
For infographics, changing the position of a picture following dynamic data.
I used the universe of Tron movie and Daft Punk for the Proof of Concept.
Ingredients:
- Lines for perspective grids
- Parameters & sliders to move the bikes
- Bar charts for the trails of bike light
- Table charts for the dynamic position of bikes
- Pictures
Nothing will derezzed🎵
Go to the Looker Studio report to play with the sliders & move the bikes!


Mehdi Oudjida
Independent Consultant in Digital Analytics
& Looker Studio Expert