
With Looker Studio - Newsletter #12


Hello,
Time is flying by, and so much has happened since the previous edition of this newsletter. I’ve been passionately working on the LS Premium Templates project and its offshoots. Little by little, the project is growing, new tasks and developments keep piling up as ambitions rise, new key elements are identified within the templates ecosystem.
I can't wait to share all of this with you, but in the meantime, let’s talk a bit about what’s new with Looker Studio and the content I’ve put together for you:
How to transform a pie chart to an advisable bar chart
Customizing your line chart to look like as a slope chart in Looker Studio
A demo of Conversational Analytics, under steroids with Code Interpreter
An important update of Looker Studio
A minor version of my Chrome Extension: Fixing problems of incompatibilities with the overhaul of the edit UI
A new just-for-fun shared report: Ranking volatility & top-selling products for e-commerce
Mehdi
Transform a pie chart to an advisable bar chart
Back to basics with this blog post.
"I understand, you like pie charts but let me propose you an alternative before deciding"
I've had to say this sentence many times, and I imagine you have too. So, here's how I usually replace that pie chart with a bar chart using Looker Studio modern-ized charts.
This article is available in English and French.

Customizing your line chart as a slope Chart
With this tutorial, let's take advantage of the new style capabilities in Looker Studio to create a nicer slope chart than before with line chart customizations.

Demo of Conversational Analytics with Code Interpreter
When Python and its libraries meet Gemini & Looker for data exploration and analysis.
This article explores what Conversational Analytics, the Looker Studio Pro's Gemini-powered AI feature, can do when supercharged with Code Interpreter. These preview features show great promise for the future.
I've played with it through a use case of multiples generation for correlation analysis, prompted with natural language 🗣️🤖.

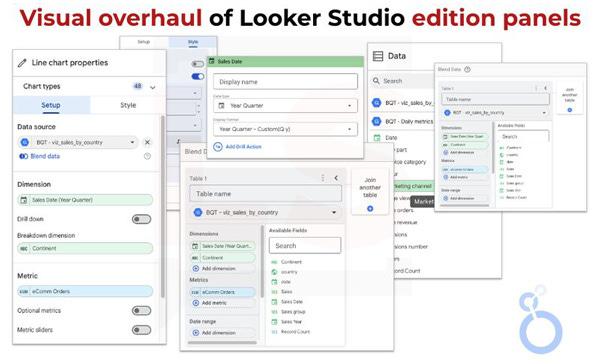
Visual Overhaul of Looker Studio edition panels
2 months ago, all the edition panels have been graphically revamped. You will find the details in the LinkedIn post.
Beyond the fresh and new feeling of discovery, there have clearly been many modifications, some beneficial to the interface, others that may raise concerns regarding usability and the cognitive effort needed to locate & identify quickly the same options.
We also noticed some bugs that avoid style changes to be saved or fields list to be loaded. Fortunately, these bugs are raised by the community and fixed by the LS team.
Chrome Extension: Compatible with the new edition panels
After the release mentioned above, I had to update the Looker Studio Companion to be compatible with the new design. Few minor fixes were necessary to retrieve all the features of settings.
A new just-for-fun shared report
Top-Selling Products & Ranking Volatility for time machines e-commerce business.
I'm very happy to share with you my latest creation in Looker Studio.
As always, it's a mix of business thinking, data modeling, Looker Studio hacks, and visual design inspiration. It was super fun to design it. Don't tell me you don't like time traveling, pop art comics and interactive ranking visualization.
Discover all the details of this project, then jump on the report to play with it.
9 just-for-fun reports are now available on the blog.
In retrospect, I realize how eclectic the topics and inspirations are. It goes in all directions which makes perfect sense for this kind of creations, often squeezed between more important side projects... but often, when an idea strikes....

Voilà, c'est tout pour le moment.

Mehdi Oudjida
Independent Consultant in Digital Analytics
& Looker Studio Expert