
With Looker Studio - Newsletter #11


Hello,
I'm back for this 11th issue of "With Looker Studio" Newsletter! It's been a while, but don't worry, I summarized all the important news of these latest months to continue sharpening your LS skills, today with:
A free Template sample for GA4Dataform
An educative way to discover Looker Studio Pro with courses
The latest updates of Looker Studio
The review of a freshly released feature: The Query Result Variables
The addition of a new feature in my Chrome Extension: Expandable sections for chart style tab
2 new free-to-use reporting tool for Google Analytics 4
A lot of contents and news...so let's start!
Mehdi
Template sample for GA4Dataform
GA4Dataform is a free solution that simplifies the process of transforming raw Google Analytics 4 data in BigQuery into actionable insights.
It offers pre-built SQL models that generate user-friendly tables. This eliminates the need for manual data cleaning and transformation, saving users days, weeks, or even months of work. GA4Dataform transform your raw GA4 event data into actionable insights with industry-leading, enterprise-level efficiency and precision. Designed for digital analysts, technical marketers, data teams, and developers.
So, this free template is a sort of starter pack based on one of the demo tables generated by GA4Dataform: A session aggregation table
If you’ve deployed the solution & scheduled the daily data refreshes in Dataform, the table is already available in your BigQuery dataset. If that’s not the case, it’s an opportunity to activate the BigQuery export of GA4 data and test GA4Dataform.
I strongly recommend to adopt GA4Dataform, built by a super talented team - Superform Labs - I had the chance to work with for this template.
Trust me, life will be smoother if you already deal with GA4 BigQuery exports.

Looker Studio Pro Essentials: New Course
Ready to learn about Looker Studio Pro (LSP) features and their benefits? You will find a new official course on Google Cloud Skills Boost.
Through educational animations - clear / nicely executed - commented with relevant examples, you will discover the following features:
Team workspaces and folders
Scheduled reports and delivery
Personal links
Advanced user management and permissions
Audit logs and security
Cloud Customer Care plans adapted to the level of requirements
And the Looker Studio community, launched last year
I reviewed the course and found it super adapted for people wondering what benefits LSP could provide and what you need to know if you've just subscribe to the offer. It will probably trigger some additional questions but the LS Community is made to find the related answers.
For the future, I would love to see additional contents in the syllabus about not covered LSP features like Alerts. Alerts feature is an important benefit of LSP.

Looker Studio new features
What a prolific beginning of year when it comes for Looker Studio team to releasing new features.
And you know what? All the additions announced last year in November for the 2025 roadmap are already available! A good signal for the future.
For now, you already have enough to explore new playgrounds, improve your reports, and without falling too far behind. Trust me by getting ahead... you will still have other things to handle and adopt later. Jump into the following and more important features / changes:
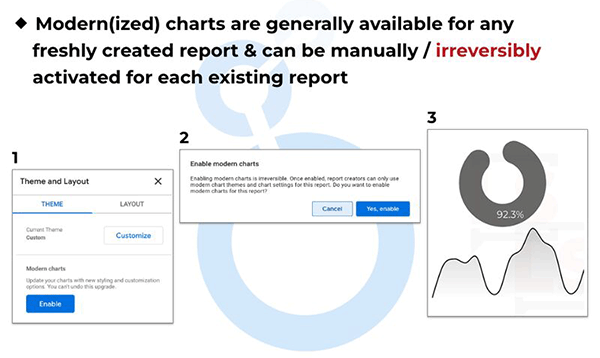
Modern(ized) charts
Graphical refreshment of charts with new welcomed style options, manually enabled for existing reportsResponsive layouts for your reports
The alternative of free form layouts for adaptative design following the width of the browser. Perfect for mobile reports. Here a demo video on LinkedIn.Query results variables
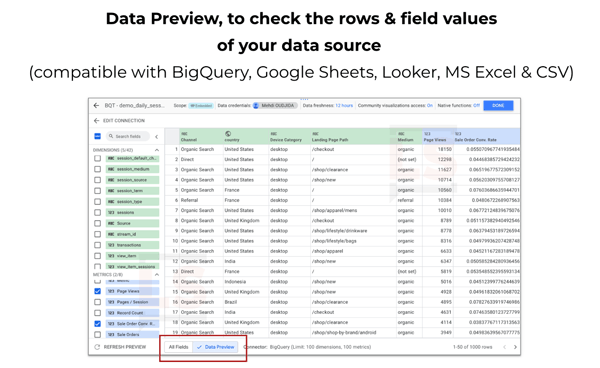
Data injection through chips in text element (see the dedicated article in the next newsletter topic)Data preview
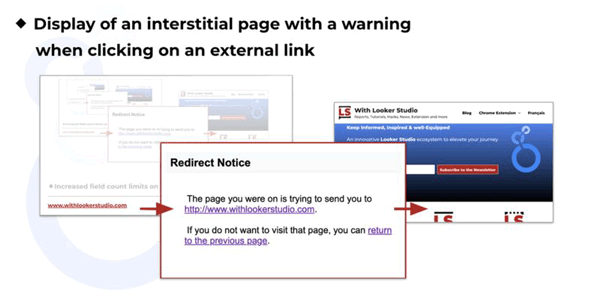
Explore easily the data of your sources with a table visualization like inside BigQuery StudioWarning for external links
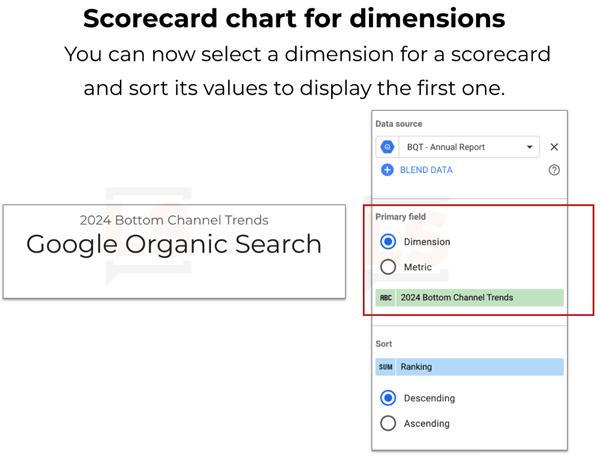
Interstitial alert when clicking on an external links. I would be nice for the future, to switch this feature as optional and based on a governance decisions, and not automatic for all links.Scorecard for dimensions
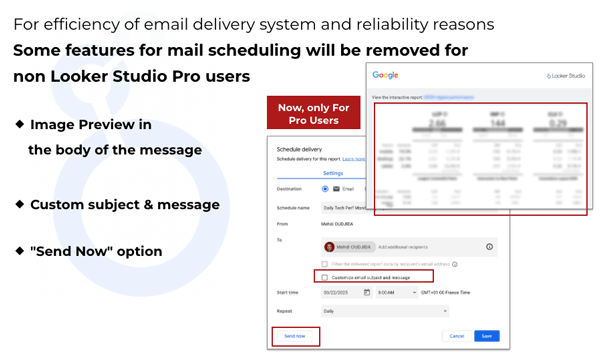
New limitations & quotas for scheduled mails
The 3 features described below will be available only for Pro users and the quotas here will be applied...and more, including improvements for Looker and partner connectors
Feature Review: Query Result Variables
Query Result Variables are insertions of dynamic data in your text elements. Discover this Looker Studio new addition through my latest post including:
Definition and use cases
How-to add it in a text element
Data configuration and selection
Styles customization capabilities
Access to the variables
Review Video
Additional remarks and limitations
This article is available in 🇬🇧 English and in 🇫🇷 French.

The LS Companion - Chrome Extension: New Feature
If you’re not yet familiar with the Looker Studio Companion, it’s an extension I developed to improve productivity when creating reports and dashboards.
It includes now the feature in action below: Expandable sections for chart style tab.
The Style tab for charts has become, over time, very rich in options. Recently, the modern(ized) charts have also brought their share of additional and very welcome customizations.
The scrolling depth needed - and the up&down scanning - to find and change a simple option has become more complicated, especially on charts like time series or tables. While waiting for an official revamp by the Looker Studio team, I addressed the issue with a new option in the Companion’s "Settings" tab with expandable sections. It makes my life easier 😁.
I hope it will also improve your experience inside Looker Studio.

Free new tools inside Withlookerstudio.com
At last, I'm happy to introduce 2 new free tools I've created with Looker Studio for Google Analytics 4 data from the native connector:
The Podium Chart
Allowing the generation of top 3 rankings using dimensions suitable for logos & pictures: GenAI traffic, Browsers, Operating Systems and Countries. Playing with perspective effects and pictures, very fun but complicated to build.The Days of Week X Hours Heatmap
The kind of visualization to identify the time slots when there is concentration of traffic, engagements or conversions.
2 ways to display directly your GA4 data through advanced interfaces. Your turn to play.


Voilà, c'est tout pour le moment.

Mehdi Oudjida
Independent Consultant in Digital Analytics
& Looker Studio Expert