
With Looker Studio - Newsletter #10


Hello,
Through this 10th issue of "With Looker Studio" Newsletter, you will find the following news and contents:
A tutorial to create a time frame control for your series charts
A quick-win solution to adapt your data model to fit with funnel chart setup
The roadmap and features announced last week by the Looker Studio team
The latest updates of Looker Studio
A new just-for-fun shared report
The recording of my talk at the first edition of the Piwik PRO Day
Mehdi
How to create a time frame control for your Looker Studio series chart
A tutorial to create a custom time frame control for your time series charts inside Looker Studio with parameters and data blending.
(article available in 🇬🇧 English and 🇫🇷 French)

How to adapt your data model to fit with the setup of the new funnel chart
The new funnel chart requires to set up 2 fields as incomes. Let's see how to adapt your existing data model when it provides a series of metrics with this blog post.
(article available in 🇬🇧 English and 🇫🇷 French)

Announced roadmap and upcoming new features
Last week, the Google Cloud BI team introduced the roadmap of Looker & Looker Studio products. Let’s debrief the announcements about Looker Studio and Looker Studio Pro and the mentioned upcoming new features. with this article.
(article available in 🇬🇧 English and 🇫🇷 French)

Looker Studio new features
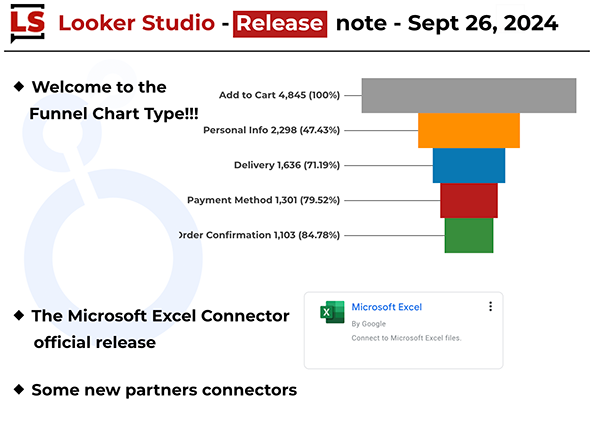
These 2 last months, Looker Studio team has released the following features:
The Funnel Chart Type
The Microsoft Excel Connector (no more in preview)
Some new partner connectors
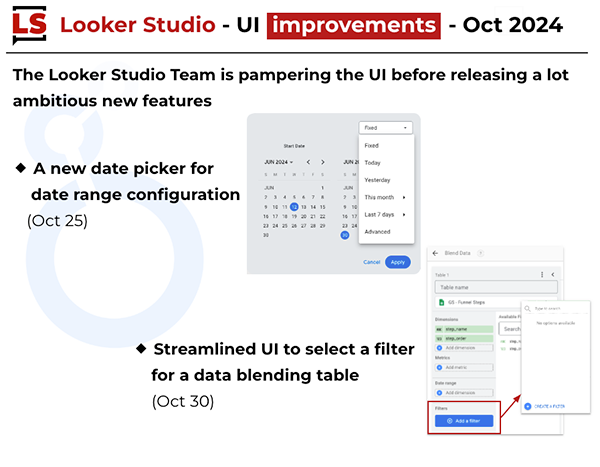
User interface improvements and preparations for coming new features
Just-for-fun shared report
Dorothy wasn’t supposed to leave the Yellow Brick Road, like a metric that is not supposed to go out of the expected ranges. So, let's go for this just-for-fun shared report inspired by The Wizard of Oz and anomaly detection series charts.🧙🏻♀️

Piwik PRO Day: Talk recording
Last October 22, it was a pleasure to talk at the first edition of the Piwik PRO Day. If you missed this nice virtual event, don't worry: A catch-up session is possible. All the recordings of the conferences are available on Youtube. Mine was about Visualizing Piwik PRO data, inside the interface of the Analytics Suite, but also with Looker Studio.

Voilà, c'est tout pour le moment.

Mehdi Oudjida
Independent Consultant in Digital Analytics
& Looker Studio Expert