
With Looker Studio - Newsletter #4


With Looker Studio - Newsletter #4
Hello,
The Looker Studio team has released yesterday nice new features before Christmas holidays.
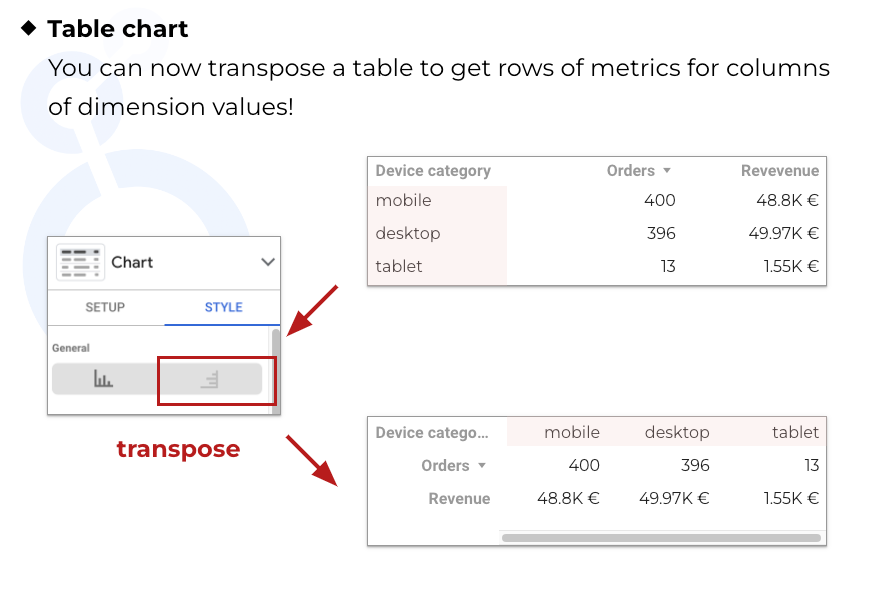
You can now transpose a table to get rows of metrics for columns of dimension values. Welcomed feature!
Contrary to my trick with Google Sheets and data blending (described in this blog post), this new built-in feature keeps the format of each metric, below number and currency.
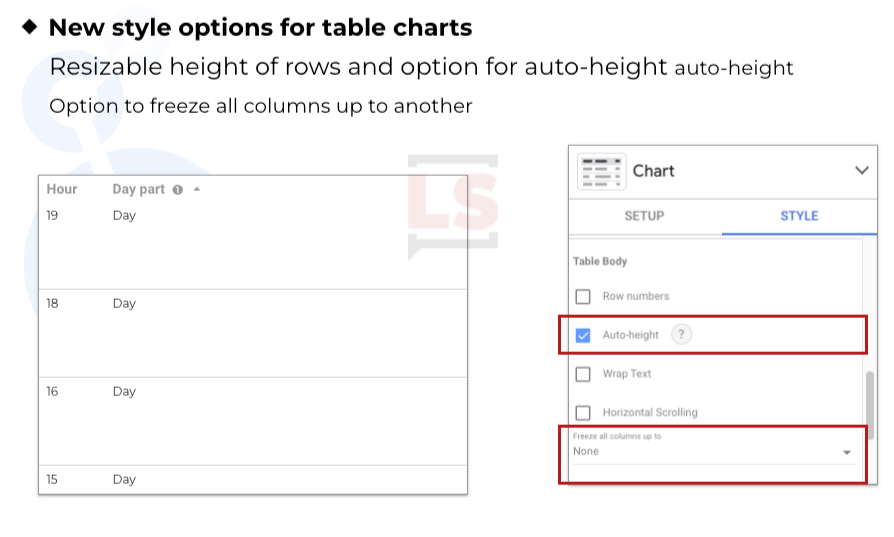
There are new style options for table charts: Resizable height of rows, option for auto-height, freeze one or more columns
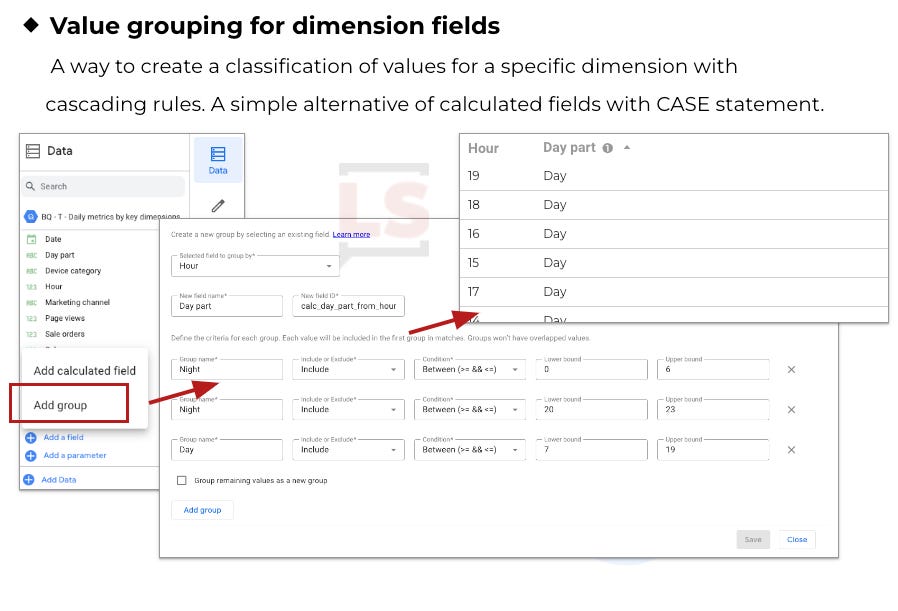
Value groups: A way to create a classification of values for a specific dimension with cascading rules. A simple alternative of calculated fields with CASE statement.
And, in case you missed it, here my latest blog article:
Mehdi
Looker Studio release - December 14, 2023
If you missed my latest blog post... How to explore schemas of BigQuery tables with Looker Studio
Usually, BigQuery helps so much to create high-level Looker Studio reports. In this article, it is the opposite, LS comes to assist BigQuery!

Voilà.
That's all for the moment, but I can tell you that I'm cooking new contents for the blog & new features for the Looker Studio Chrome extension.
So stay tuned ;)

Mehdi Oudjida
Independent Consultant in Digital Analytics
& Looker Studio addict