
Looker Studio Custom Visualization for Funnel Charts

Do you often need to include conversion funnels in your LookerStudio reports? And are you regularly frustrated by not achieving the desired result?

If so, I have a new little custom visualization cooked up just for you. 🎨
Let’s build later the funnel chart I need …or maybe now
It could get you out of some sticky situations that are hard to handle with the funnel chart offered by Looker Studio or through a table chart on steroids, as I often do for my clients.
I had planned to create this type of visualization later, one where I have full creative freedom and flexibility, as part of a larger project.
However, an event accelerated things.
A few weeks ago, I learned through a discussion with Michele Kiss on #measure Slack channel (the place to be if you want to join an amazing community of analytics practitioners helping each other - end of the promo moment) that a custom funnel chart visualization created by the Ayima agency had been decommissioned.
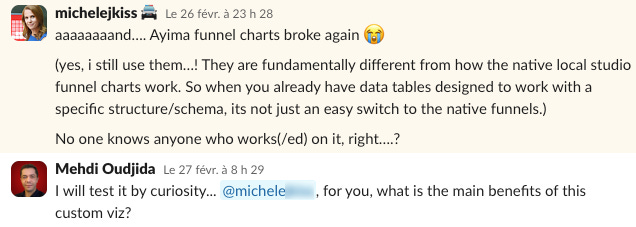
This custom viz was practical for some Looker Studio users because it took a list of metrics as input to draw the funnel, rather than a single metric broken down by a dimension as Looker Studio’s native funnel chart does.
The Funnel Chart proposed by default in Looker Studio
On the other hand, personally, the funnel chart provided by Looker Studio can handle simple needs. But the overly automatic responsive behavior of the elements it includes makes things difficult when you want to add it to a specific area of a page…and keep it easy to read.
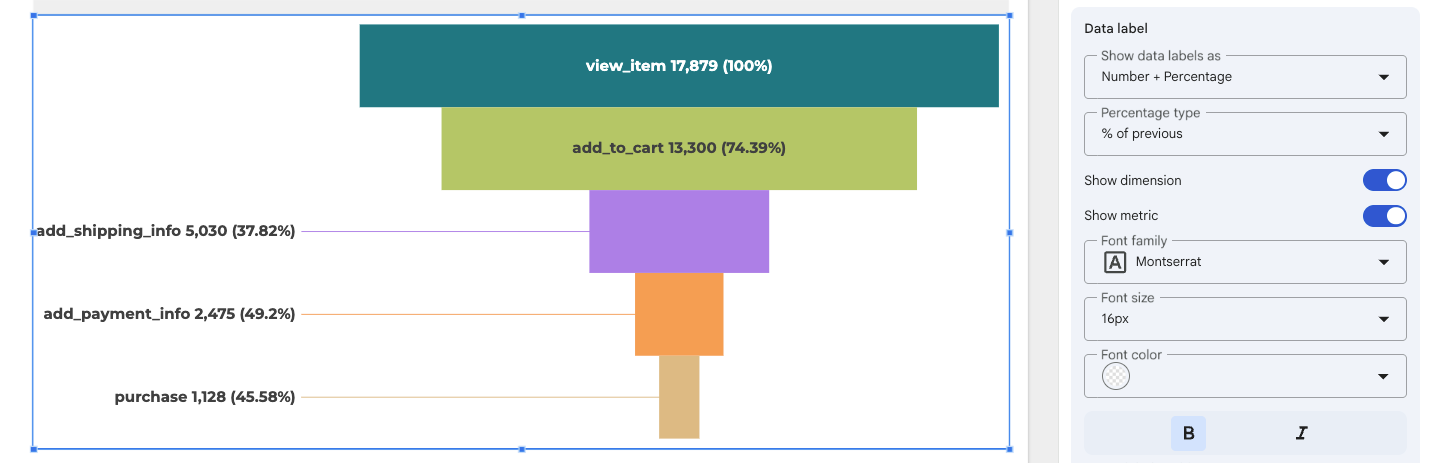
My operational version of funnel chart
So, tackling these two major limitations was what I had in mind:
The data model flexibility
A purely tabular drawing approach with numerous styling options to calibrate the visualization exactly as desired
It’s done, and it’s a gift!

I've lost count of how many times writing an article or developing a component started with a discussion on our measure Slack channel. Here's one more.
Free and maintained as part of a whole
This version is completely free and it will be permanently available as part of an encompassing product roadmap. Don’t worry, it won’t disappear, and in fact, it will get better over time. I already have upgrades in mind.
I would be happy to get your feedback.
More information about the Funnel Chart
Now, if the way I’ve addressed my own needs resonates with the challenges you’re facing with funnel charts, I invite you to try out this new custom viz. You can find all the details on this page. And if you have any questions, you know where to find me!
Post Scriptum
However, watch out, I can see the funnel critics coming: We agree, UX is anything but a funnel, but I’m sure you use plenty of other modelling and abstraction tools that are only there to represent a form of digestible reality 😛